
Sometime around the third week of measuring impulse responses, you stop being a person and start becoming a kind of bipedal microphone stand. You think in milliseconds. You dream in 1/3-octave bands. You start a sentence with “well, the L1 axial mode at 24 Hz…” at a dinner party, and the people around you nod politely while quietly reconsidering the friendship. Welcome to certifying a Dolby Atmos Music Studio.
This is the price you pay to put a Dolby DARDT certification on a wall, and we have just paid it for IndigoCorvid Studio A. As of April 25, 2026, Room A is officially submission-ready as a Dolby Atmos Music Studio, 7.1.4 layout, with the receipts to back it up.
What a Certified Dolby Atmos Music Studio Actually Means
For the unfamiliar: getting a room through Dolby’s certification process is less “we like the way it sounds” and more “please prove, with measurements, that this room behaves like a real Atmos room and not just an enthusiastic walk-in closet.” DARDT (the Dolby Atmos Acoustic Room Tool) wants numbers. Lots of numbers. About:
- Geometry — does the room match the layout you said it did?
- Time alignment — do all the speakers actually arrive at the mix position at the same time?
- Level match — are they all the same loudness when they get there?
- Frequency response — does the in-room curve track the Atmos Music target?
- Decay (T20) — does the room stop ringing within Dolby’s reverberation window?
Each of those gets its own set of acceptance windows. Miss any of them by enough, and the room is “informational” — which is Dolby’s polite way of saying “no.”
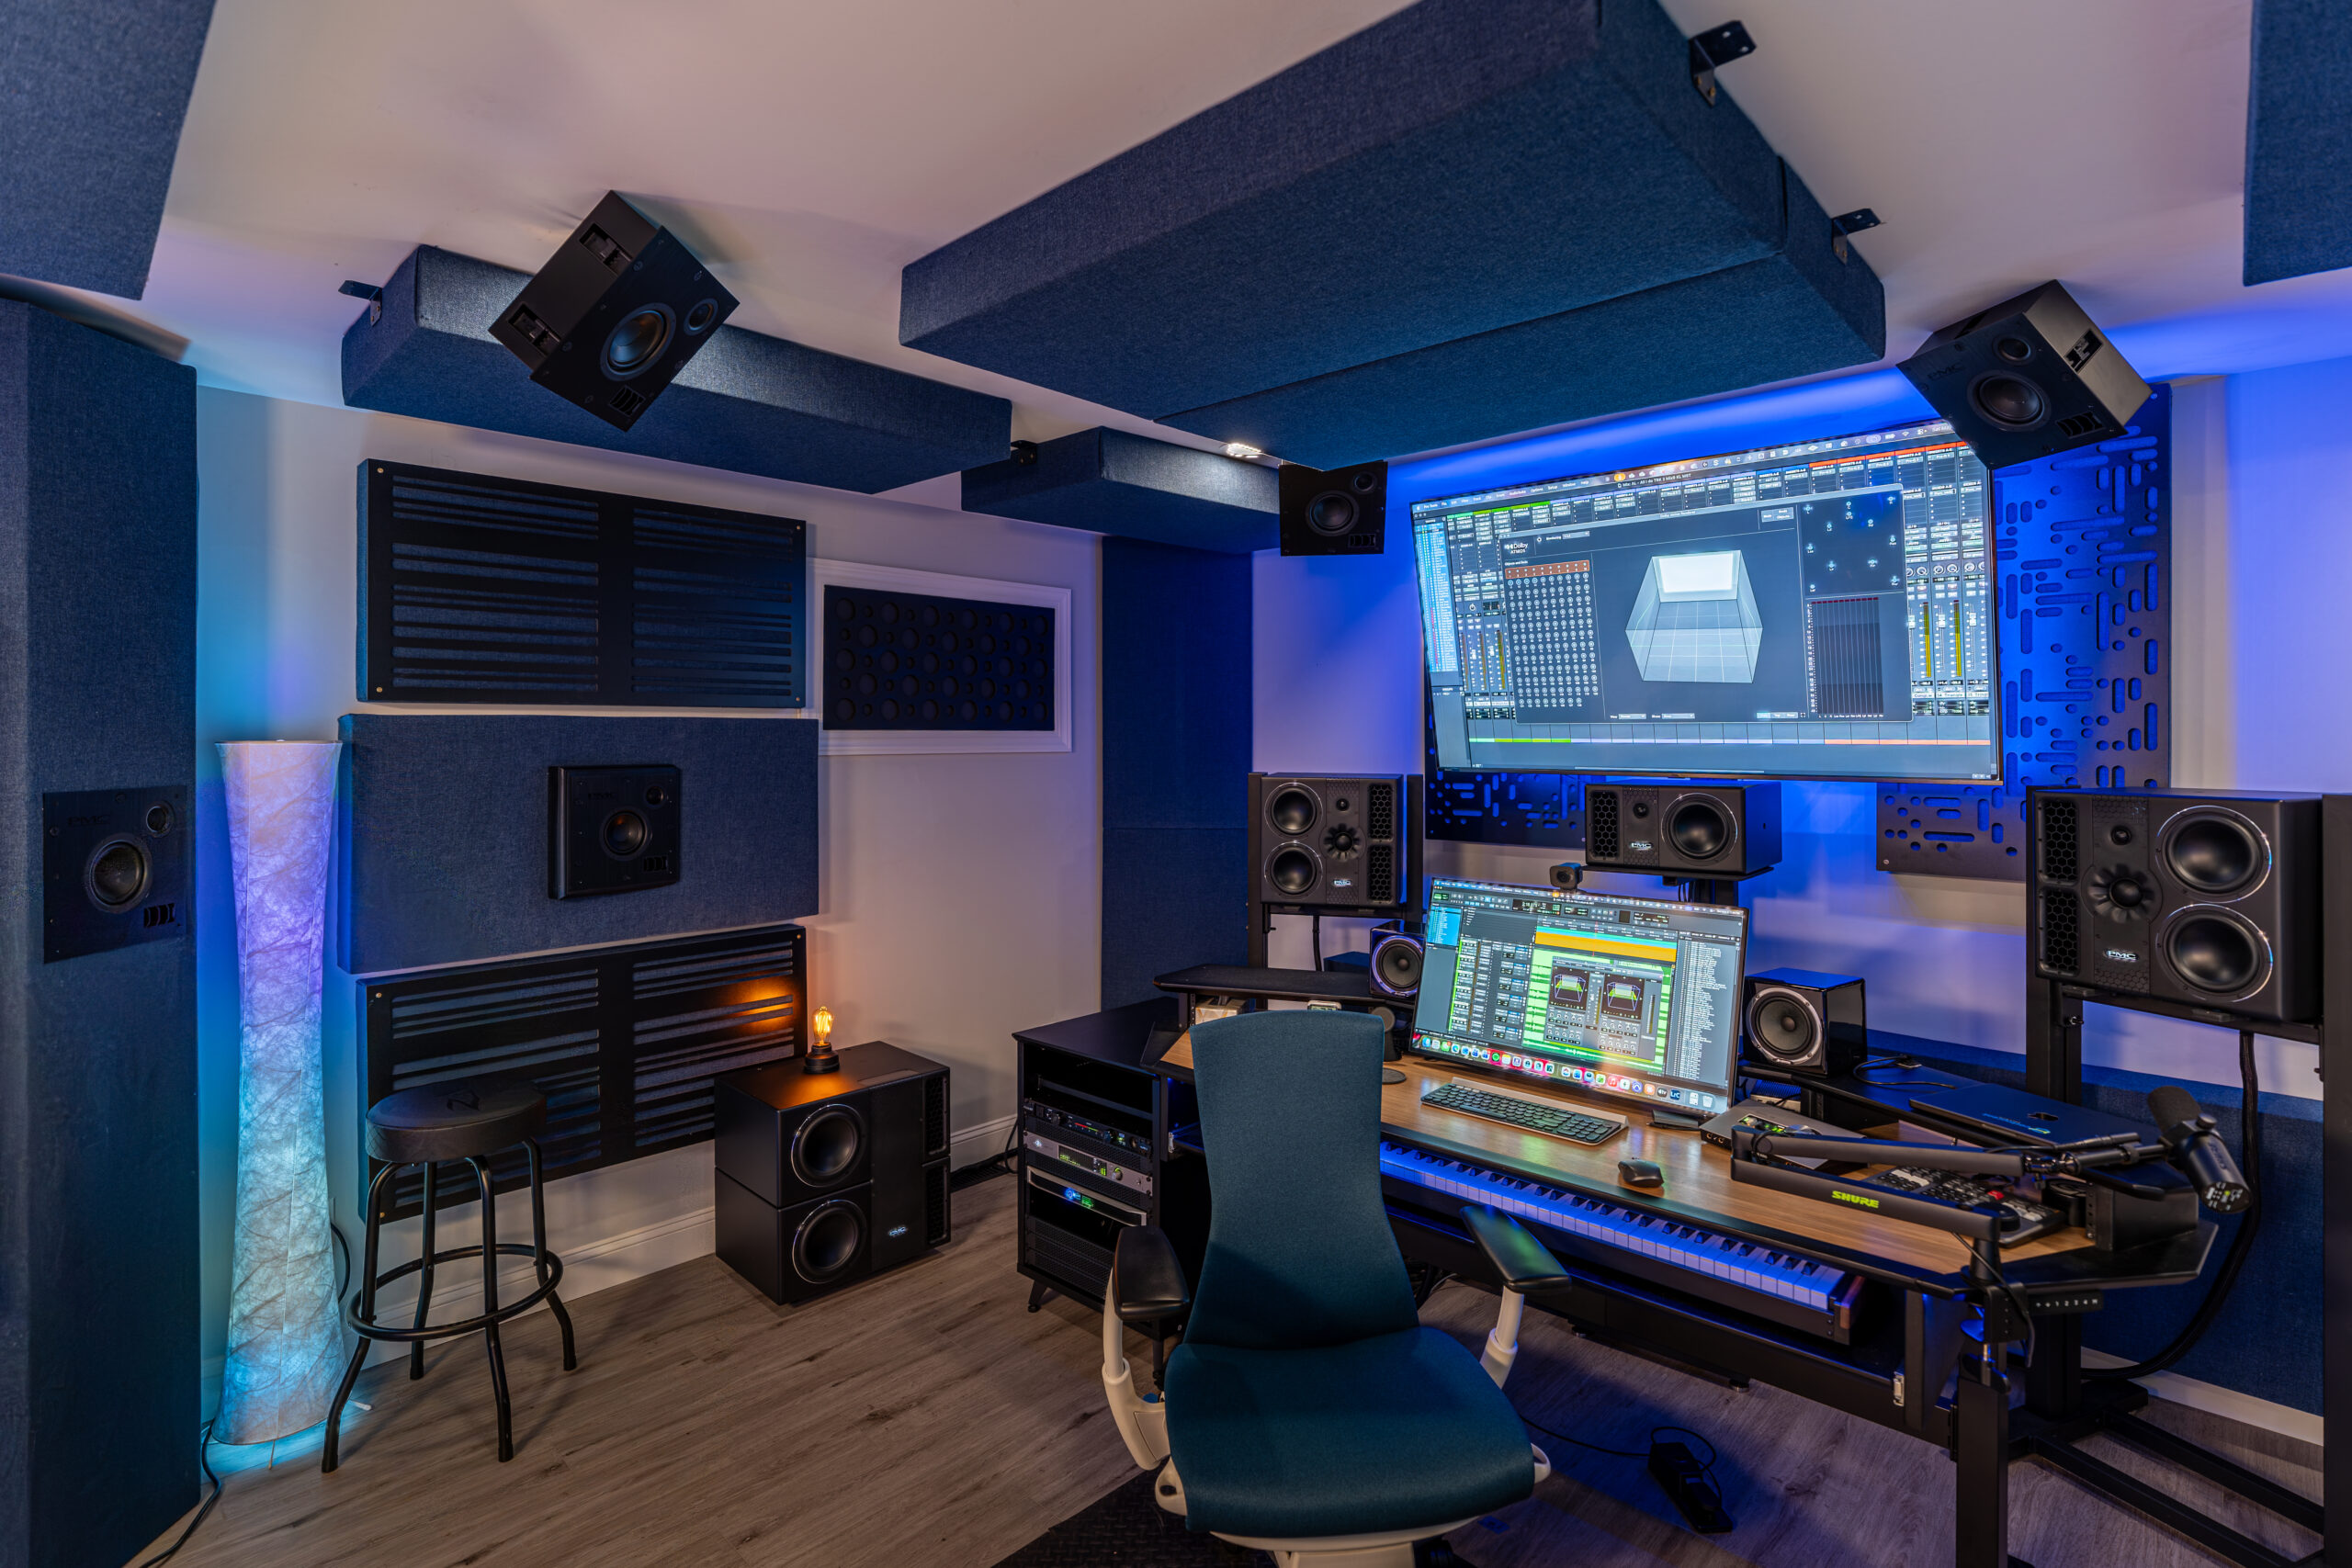
The Room
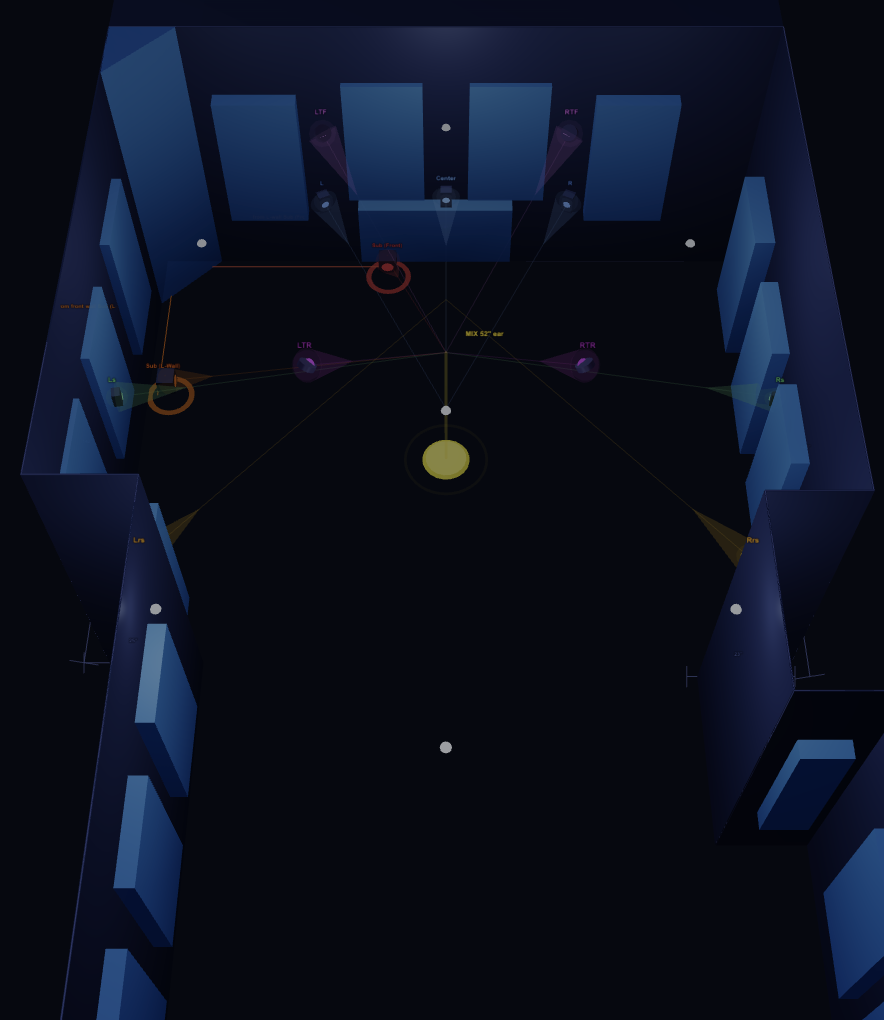
Room A is 181″ wide × 95″ tall with 280–283″ of depth — about 15 × 23.5 × 7.9 ft — narrowing to a 156.5″ back wall to give the listening end a slightly trapezoidal footprint. (The DARDT workbook entry quotes the 12.16 × 15.08 ft cert-area footprint at the front of the room; the actual treated space is bigger.) Mix position is 76.8″ from the front wall, 90.5″ from the left wall, and 52″ off the floor at ear height. The cast list:
- PMC 6-2 for L/R, PMC 6 for center, twin PMC 8-2 SUB in a front + side-wall configuration.
- LEA Connect 168N handling the surround bed and the four height channels.
- Universal Audio Apollo x16 Gen 2 doing bass management and hosting the Sonarworks SoundID Reference Atmos Music target curve.
- PMC SoundAlign on the fronts, doing per-channel delay and per-sub PEQ before SoundID ever gets to look at the signal.
That’s three different DSP layers in series, each correcting things for the next layer in line. The trick of the whole calibration is making sure none of them argue.
The Calibration, In Order
The chain we settled on, top to bottom:
- PMC SoundAlign sets front delays, per-sub time alignment, and per-sub modal PEQ. The sub PEQ is the heavy lifter here: a −8 dB / Q4 cut at 27 Hz to wrestle the L1 axial mode (more on her later), a −8 dB / Q4 cut at 80 Hz to keep the H1 / W2 / L3 tri-axial cluster from shouting, and a +2 dB / Q2 lift at 67 Hz to fill the modal trough between them. Surgical. We were proud.
- LEA Connect 168N carries the surround and height delays. The heights need the most pre-delay (2.6–3.4 ms) because they’re physically the closest speakers to the mix position, which is one of those facts that sounds wrong until you stop and think about it.
- SoundID Reference, running on the Apollo, cleans up whatever is left and locks the in-room response to the Atmos Music target curve.
Right Rear Surround sits at 0 ms residual — it’s the longest physical flight path from the listening seat, so it’s our reference. Everything else gets advanced relative to it.
The Numbers
We pulled 13 impulse responses with REW on 4-25-26 and ran them through Schroeder integration with a 4th-order Butterworth bandpass — the standard cookbook for T20, T30, and EDT. The summary, with the appropriate amount of feigned modesty:
- Time alignment: all 11 bed and height channels within ±0.8 ms residual after the full HW + SoundID stack. Dolby allows ±2 ms. We had room to spare.
- Level match: worst-case ±1.4 dB across the same 11 channels (LFE excluded because LFE always lives in its own +10 dB world).
- T20 at 2 kHz: 0.205 s. T20 at 4 kHz: 0.210 s. Dolby’s target is 0.25 s. Inside the band, on both bands.
- Frequency response: evaluated against the Atmos Music target (which carries an intentional +3 dB low-shelf below ~150 Hz, so don’t @ us about the bass), inside the cert window.
at MLP
(excl. LFE)
(target 0.25)
(target 0.25)
(edge of 0.50)
The Boss Fight: A 24 Hz Axial Mode
Every room has a villain. Ours is a length-axis mode at 24 Hz that rings into the 25–28 Hz region with an audible “I am here, please respect me” tail. On the 31.5 Hz octave band, T20 came in at 0.548 s — exactly at the upper edge of Dolby’s 0.50 s ceiling. T30 at the same band is 1.192 s, which is a polite way of saying “she keeps going past the −25 dB knee.”
This is the dirty secret of small-room low-frequency control: porous absorption is depth-limited at those wavelengths. A 25 Hz wave is roughly 45 feet long; you can’t fix that with a 4″ Rockwool panel and a hopeful expression. We tamed the peak with the −8 dB / Q4 PEQ at 27 Hz, which holds the FR to a manageable +8.5 dB residual, but the tail is still in there, doing its thing. Short of adding membrane absorbers or a DBA-style sub array — both of which were politely declined by the room’s footprint and budget — this is as good as the band gets.
And here is the wonderful, slightly subversive thing about Dolby’s cert framework: it knows that. The 0.50 s ceiling at 31.5 Hz is generous on purpose. We sit right at the edge of the band, which on paper looks scary, but in practice means the room is doing exactly what a treated music room of this size should do.
The Quiet Brag: Mid-Band Damping
The other thing the measurements turned up is that Room A is actually over-damped in the 250 Hz – 800 Hz region. T20 at 250 Hz is 0.140 s; Dolby’s lower target is 0.30 s. Over-damping is treated as informational rather than a failure — it means the room is dryer than the spec, not livelier — but it’s also a deliberate creative choice. Atmos Music mixing benefits from a tight direct field where small spectral details survive the trip from speaker to ear without the room editorializing. Room A is a room that gets out of the way.
(Translation for the dinner-party version: the room shuts up so the mix can talk.)
What We’re Submitting
The DARDT package going to Dolby includes the 04-25 measurement set (.mdat with all 13 IRs, the 32-bit float L+R+LFE summed wav, the 12-channel SoundID project file), the DARDT workbook (v6.4.0, HE+Music) with the room geometry, and a small zoo of screenshots showing PMC SoundAlign, LEA Connect, and SoundID Reference in their final cert-day configurations. Plus the analysis report — frequency response, decay curves, per-channel residuals — that lets the reviewer trace every claim back to the underlying impulse response.
Status: time alignment ✓, level match ✓, FR vs Atmos Music target ✓, geometry ✓, decay ✓ everywhere except the 31.5 Hz band, where we sit honestly at the edge of the band and explain why.
It’s the kind of submission we’re happy to put our name on.
Credits Where Credit’s Due
A room like this is never one person’s work, and we’d be remiss not to name the people who made this submission possible:
- Mike Major, Acoustic Engineer at GIK Acoustics — room design and measurement review. The treatment plan, the trap placement strategy, and the sanity check on every set of curves we sent him; the fact that we’re sitting at the edge of the 31.5 Hz band rather than well past it is a direct consequence of his guidance.
- Bob Gretz, head carpenter and construction manager — every wall, soffit, riser, and bass-trap frame in the room. The geometry only works because the build is square (and where it isn’t square, it’s deliberately not square).
- Riley Koenemann at Sweetwater — product support across the entire signal chain. Patient, precise, and unflappable when we asked the same question three different ways. (We always do that.)
Onward as a Dolby Atmos Music Studio
If you’re considering a similar process — whether that’s a new room build, a calibration overhaul of an existing room, or you’re staring at REW for the first time and wondering whether T20 and T30 are different cousins of the same number — get in touch. We’re tired (in the good way), but we’re also incurably enthusiastic about this stuff, and we have the spreadsheet to prove it.